How Age Shapes the Workplace Experience: Survey Insights for HR Professionals

4 min read 

SHARE ON

How does age shape the workplace experience and what can HR professionals learn from their employee survey response patterns? Our People Science Team explored data across various survey statements and uncovered intriguing differences between the youngest and oldest age brackets in the workforce. These findings highlight the importance of understanding employees’ unique perspectives at different career stages and using this knowledge to drive meaningful action.

Read on to discover how workplace surveys differ by age group, including loyalty, pay, work-life balance, and more.

Where older employees give workplace experience top marks

Workers aged 65 or older consistently report some of the most favorable survey scores, including an impressive 82% favorable Workplace Experience (WX) score. Meanwhile, younger employees tend to score slightly lower than other age groups, with those less than 25 years old scoring 76% favorable on overall WX.  How do older employees compare to their younger counterparts? Interestingly, older workers have similar or higher scores on nearly every survey statement compared to their youngest colleagues, who are typically new to the workforce and early in their careers. These differences are most extreme in these statements:

Loyalty

Survey statement: I have not considered searching for a better job in the past month.”
  • Employees 65 or older: 82% favorable
  • Employees less than 25 years old: 57%

While older employees averaged scores of 82% favorable on Loyalty, employees under 25 scored just 57% (a difference of 25 points!). However, this is likely more of a product of where these employees are in their careers than some generational difference in philosophy on commitment owed to organizations. Employees 65 or older are at or nearing retirement age and are far less likely to be considering moving to another organization so close to their retirement. 

In contrast, younger employees are in the early years of their careers, and moving between organizations can help them develop and increase their earning potential more quickly. They also may have fewer geographic limitations to consider due to lower rates of home ownership and increased opportunities for remote work, and thus be more likely to move, increasing their ability (and potentially necessity) to change organizations.

Pay

Survey statement: “My pay is fair for the work I do.”
  • Employees 65 or older: 74%
  • Employees less than 25 years old: 59%

Older employees averaged 15 points higher on Pay compared to younger employees. Similar to Loyalty, this is likely in part due to where employees are in their careers, as well as where they are in their pay scale. While older employees have likely been working for decades and have hopefully seen their pay increase proportionally, younger employees may still be on the low side of their pay scale due to their inexperience and in lower-level positions that tend to pay less. 

Macroeconomic factors may also play a role, as older employees may be somewhat more insulated from increased costs of housing and other issues that younger employees may feel more keenly, and thus influence their perception of their pay.

Work-life

Survey statement: “I have the flexibility I need to balance my work and personal life.”
  • Employees 65 or older: 89%
  • Employees less than 25 years old: 76%
Older employees averaged 13 points higher than their youngest colleagues. Some of these differences may be explained by older employees having more latitude in their work planning due to their experience and likely higher-level positions. It may also be that they have adjusted to work demands and scheduling over time and feel comfortable with the resulting balance they’ve achieved.  There also may be differences in expectations for work-life flexibility and balance across different age groups, with older employees potentially expecting less balance than their younger counterparts.

Meaningfulness

Survey statement: “My job makes me feel like I am part of something meaningful.”
  • Employees 65 or older: 91%
  • Employees less than 25 years old: 79%
Older employees were 12 points higher than younger employees. Unlike the previous statements, this is a bit less obvious about why we might see differences in results across age groups. It’s possible that older employees tend to be in higher-level positions that have more impact on decisions related to the organization’s goals and direction and thus see more direct impact from their work.  In contrast, younger employees may often be in lower-level roles where their work is more monotonous, and the impact of that work is unclear, resulting in them finding less meaning in their work.

Areas where younger employees rate employers higher

Employees in all age brackets score in a wide range of ways at the individual, departmental, and organizational levels. So if younger employees at your organization score higher than their older colleagues, don’t be surprised. This is particularly true as those in the 65 and older age group tend to be quite small within organizations, so their scores tend to be more extreme than those of larger groups.  At the meta-level, we also see employees less than 25 years old score higher than their older colleagues on one statement:

Development

Survey statement: “My manager helps me learn and grow.”
  • Employees 65 or older: 83%
  • Employees less than 25 years old: 85%
Older employees averaged 2 points lower than younger employees. This isn’t an extreme difference, but it is interesting nonetheless. It may be the case that older employees feel that they no longer have much to learn in their current role. They may also feel that their manager is ill-equipped to help them grow or has not taken the time to try, as some managers may focus their energies on younger or less experienced employees. Younger employees may reap the benefits, with managers focusing more time and attention on helping them develop their skills and abilities. Ultimately, the score difference is small but may indicate that managers should strive to remember to support all of their employees in their development, regardless of age.

What generational differences mean for acting on survey results

Ultimately, age is just one lens to use when reviewing survey results. If there are extreme differences in scores between different age groups, and they can’t be explained by differences in job grades, salary, or other organizational factors, it may be helpful to consider different age groups’ respective stages of life and careers.

See how your organization compares

Tap into the power of the Energage Platform to survey your employees and measure the impact of age on workplace sentiment. Gain actionable insights and compare your results to the trends uncovered here to better understand your workforce’s needs and improve engagement across all age groups.

Experience the nation's leading employee engagement survey

Get Recognized as a Top Workplace

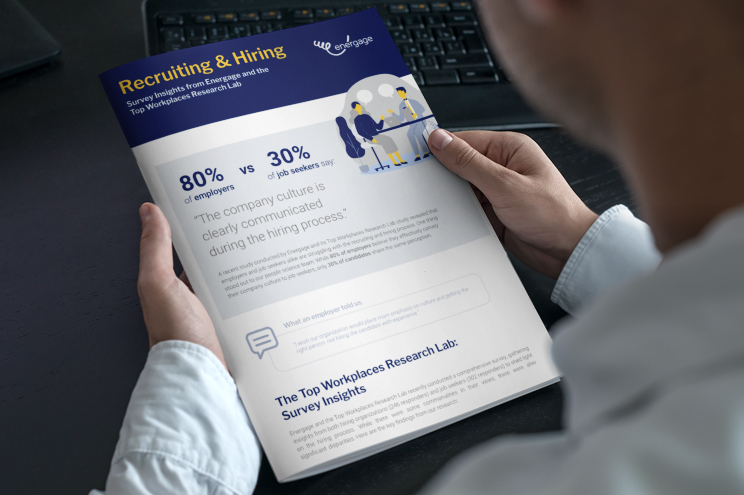
Win the Hiring and Recruiting battle.

Download the  Energage and Top Workplaces Research Lab case study to get the latest insights on ‘Hiring and Recruiting”